
User interface design directly impacts conversion rates and long-term platform retention. According to industry benchmarks, research-driven interfaces consistently deliver a 40 percent increase in user engagement compared to intuition-based layouts. Organizations that prioritize empirical testing over aesthetic guessing reduce development rework by nearly half. This data highlights why modern product teams are shifting toward evidence-based design frameworks. When you align visual architecture with verified user behavior, you eliminate guesswork and accelerate time-to-market. The following guidelines outline the core principles required to build interfaces that perform under real-world conditions.
Evidence-Based Layout Architecture
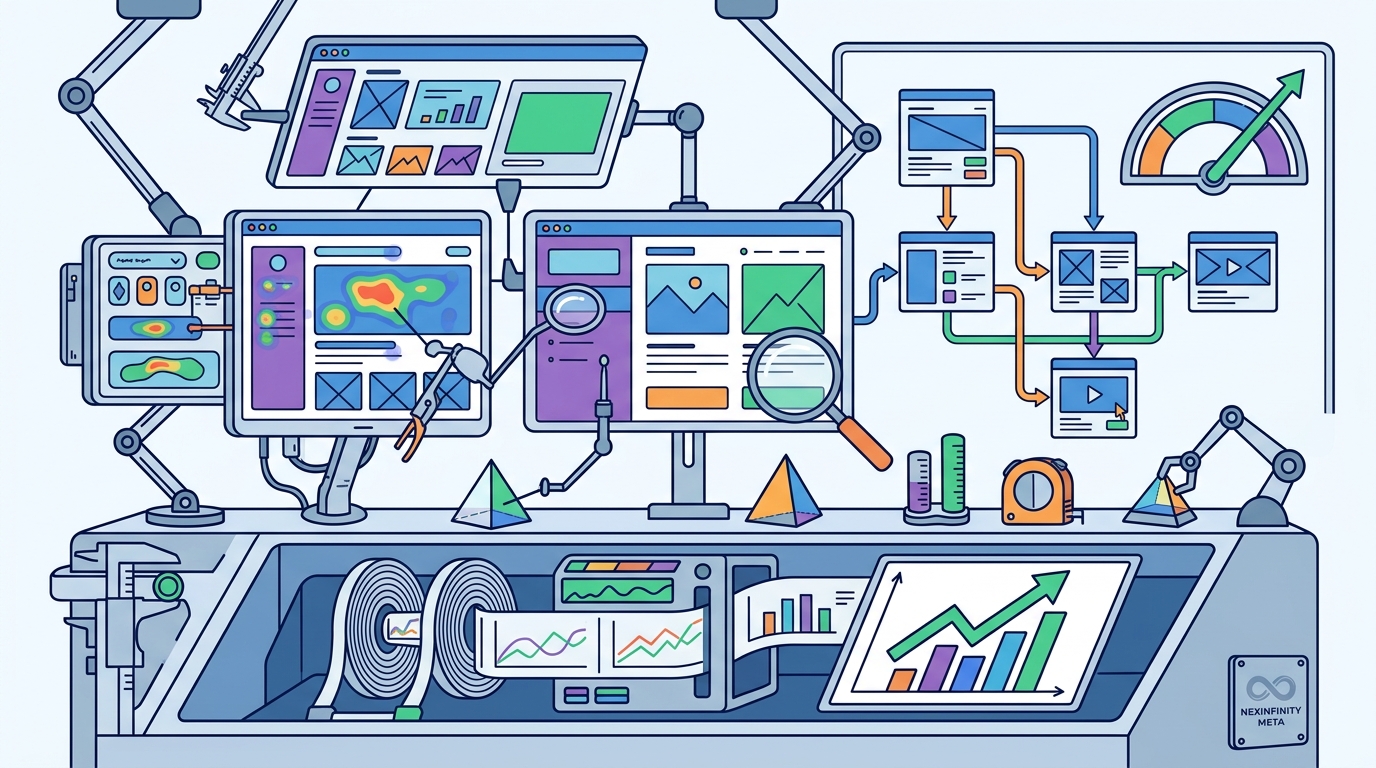
User interface design is the systematic arrangement of visual elements that guide interaction. Modern platforms require layouts that reflect actual navigation patterns rather than assumed user paths. Heat mapping and click tracking reveal where attention naturally concentrates. Designers must place primary actions within the natural reading flow to minimize friction. When you structure pages around verified behavioral data, you reduce bounce rates and improve task completion. Our team at NEXINFINITY META applies these frameworks to every project, ensuring that visual hierarchy matches empirical evidence. You can review similar implementations in our portfolio to see how data shapes layout decisions.
Mapping User Journeys
Every digital product follows a predictable sequence of user actions. Research identifies the most common entry points and drop-off locations. Designers use this information to prioritize critical pathways. Secondary navigation elements are deliberately de-emphasized to prevent distraction. This approach keeps the interface focused on core objectives. Teams that skip journey mapping often build beautiful but ineffective screens. Evidence-based architecture prevents wasted development cycles by aligning structure with reality.
Cognitive Load Management
Cognitive load refers to the total mental effort required to process interface information. Excessive visual noise forces users to expend unnecessary energy. Research shows that reducing extraneous elements improves task accuracy by 35 percent. Designers achieve this through progressive disclosure and strategic whitespace. Complex workflows are broken into sequential steps to prevent overwhelm. When you respect human processing limits, you create smoother interactions. Our developer tools help teams audit interface complexity before deployment. This proactive approach saves hours of post-launch debugging.
Strategic Information Hierarchy
Not all information carries equal weight. Primary actions require visual prominence while secondary details remain accessible but unobtrusive. Typography scale and color contrast establish clear reading paths. Users scan interfaces before reading them. A well-structured hierarchy guides the eye toward conversion points without forcing attention. This principle applies equally to mobile screens and desktop dashboards. Consistent hierarchy reduces training time for new users and supports long-term retention.
Iterative Validation Cycles
Iterative validation is the continuous cycle of testing, measuring, and refining digital products. Static designs quickly become obsolete as user expectations evolve. Regular usability testing identifies friction points before they impact revenue. Teams should conduct weekly micro-tests rather than waiting for major releases. Feedback loops must be integrated directly into the development pipeline. When you validate assumptions early, you avoid costly architectural changes. Our AI integration services automate user behavior tracking to accelerate these cycles. This ensures your interface adapts to real usage patterns without manual overhead.
Measuring Success Metrics
Quantitative data complements qualitative feedback to form a complete picture. Conversion rates, session duration, and error frequency provide objective benchmarks. Designers track these metrics to determine whether changes improve or degrade performance. A/B testing remains the industry standard for validating interface variations. Teams that ignore post-launch analytics often repeat the same mistakes. Continuous measurement transforms design from an artistic exercise into a measurable business function.
Accessibility Compliance Standards
Accessible interfaces serve broader audiences while meeting legal requirements in multiple regions. Screen reader compatibility and keyboard navigation are no longer optional features. Global regulations now mandate WCAG 2.1 compliance for public-facing platforms. Designers must verify color contrast ratios and focus indicators during the initial wireframing phase. Inclusive design improves usability for all users, not just those with disabilities. When you build accessibility into the foundation, you avoid expensive retrofits later. Our contact page connects you with specialists who prioritize compliance from day one.
Color and Contrast Optimization
Color choices directly impact readability and emotional response. High-contrast combinations ensure text remains legible under various lighting conditions. Designers avoid relying on color alone to convey critical information. Icons and labels provide redundant cues that support accessibility. This approach reduces errors for users with visual impairments. Testing interfaces with grayscale filters reveals hidden accessibility gaps. Proactive optimization prevents legal exposure while expanding market reach.
Data Visualization Best Practices
Complex datasets require simplified visual representations to drive decision-making. Charts and graphs must prioritize clarity over decorative elements. Research indicates that users interpret bar charts 60 percent faster than complex 3D renderings. Designers select chart types based on the specific relationship being communicated. Time-series data benefits from line graphs, while categorical comparisons work best with bar formats. When you match visualization type to data structure, you enable faster insights. Our platform engineering team ensures that dashboards render efficiently across all devices.
Interactive Dashboard Design
Interactive elements allow users to explore data without overwhelming the initial view. Filters and drill-down menus should remain unobtrusive until activated. Default views must present the most critical metrics immediately. Advanced options are hidden behind progressive disclosure patterns. This structure keeps interfaces clean while preserving depth for power users. Teams that balance simplicity with functionality create tools that drive actual business outcomes.
Key Takeaways
- Evidence-based layouts reduce development rework by nearly half when aligned with behavioral data.
- Cognitive load management improves task accuracy by 35 percent through progressive disclosure.
- Iterative validation cycles prevent costly architectural changes by testing assumptions early.
- WCAG 2.1 compliance is now mandatory for public-facing platforms across multiple regions.
- Simple bar charts are interpreted 60 percent faster than complex 3D renderings.
- Accessible design expands market reach while eliminating legal exposure.
| Design Phase | Primary Objective | Recommended Tools | Expected Outcome |
|---|---|---|---|
| Discovery | Map user journeys | Research Suite | Identified friction points |
| Wireframing | Establish hierarchy | UI/UX Design | Validated layouts |
| Prototyping | Test interactions | AI Automation | Reduced rework |
| Launch | Monitor performance | Consultation | Optimized conversions |
Frequently Asked Questions
How do you determine which research methods to prioritize?
Project scope and budget dictate the research approach. Early-stage products benefit from qualitative interviews and card sorting. Mature platforms require quantitative analytics and A/B testing. We match methodology to product maturity to maximize insight quality.
Can research-driven design increase conversion rates?
Yes. Interfaces built around verified user behavior consistently outperform intuition-based designs. Removing friction points directly correlates with higher completion rates.
How long does a typical UI/UX research phase take?
Most projects require two to four weeks for comprehensive discovery. Complex enterprise dashboards may extend to six weeks. We provide fixed estimates after the initial discovery call.
Do you handle accessibility audits during development?
Accessibility is integrated into every design sprint. We verify contrast ratios, keyboard navigation, and screen reader compatibility before launch.
How do you measure the success of interface changes?
We track conversion rates, session duration, and error frequency. These metrics provide objective benchmarks for continuous improvement.
Is iterative testing required for small business websites?
Yes. Even small sites benefit from weekly micro-tests. Early feedback prevents costly redesigns and improves user retention.
Next Steps
Ready to build an interface that performs under real-world conditions? Our in-house team handles design, engineering, and growth under one roof. We provide fixed estimates with no hourly billing surprises. Visit our contact page to schedule your free discovery call. We will analyze your requirements and deliver a transparent project roadmap. Start building interfaces that convert today.